CALIFORNIA, September 20, 2017 - Thanks to more than a year’s planning, the California Independent System Operator (ISO) says it handled a major drop in solar power output seamlessly during the Great American Eclipse last month. Solar contributions on the electric system dropped by 55 percent on Aug. 21, according to an analysis released last week.
 Grid-connected solar generation tumbled more than 3,500 megawatts (MW) in just over an hour, not including wattage lost from rooftop solar installations, estimated at up to 1,500 MW. Declines in solar generation were replaced with increased electricity imports including from hydropower and natural gas power plants.
After the sun emerged from the eclipse, solar production ramped up quickly, as much as 150 MW a minute, before leveling off to normal conditions. The ISO says that as the electric system with the most solar capacity in the nation, the ISO power grid and energy market performed efficiently during the three-hour eclipse, with operators reporting no troubles managing the drop-off and steep rise in solar generation.
The success of the market during the event illustrated the potential resiliency of power grids absorbing growing amounts of renewable energy. The ISO says it began planning more than a year ago for the expected drop in solar production during the eclipse, which covered anywhere from 55 to 80 percent of the sun in the ISO footprint. Final totals closely matched ISO’s projection and the team says it saw no big surprises in the outcome.
“This event capped a great team effort by the ISO staff and our many partners,” said Eric Schmitt, ISO vice president of operations. “And the preparation paid off. The market ran remarkably smooth, with little or no intervention from grid operators.”
California has the highest green energy goals in the country, with a mandate for getting half of its electricity from renewable sources by 2030. The ISO has experienced explosive growth in solar generation in the past few years. With around 10,000 MW of utility-scale solar, and an estimated capacity of about 6,000 MW in rooftop installations, solar resources cover as much as 30 to 40 percent of the grid’s energy needs on some days.
“The ISO market seamlessly made up for the loss of the solar output and the dramatic ramp back to full solar generation,” said Nancy Traweek, ISO executive director for grid operations. “After months of planning, it was exciting to watch the solar eclipse unfold from an energy management perspective.”
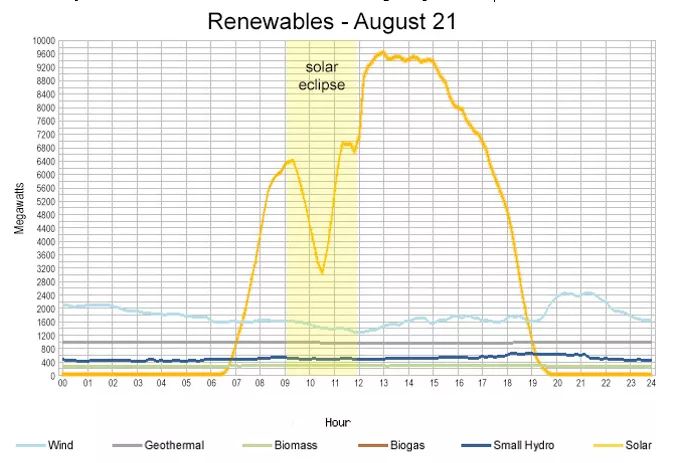
At the start of the eclipse at 9:11 a.m. Pacific Time, solar production was at 6,392 MW, then fell to a low of 2,845 MW at the maximum occlusion of the sun at 10:24 a.m., or a dip of 3,547 MW, according to ISO figures. One megawatt typically powers 750 to 1,000 homes. During the eclipse, the solar output fell an average rate of 48.4 MW per minute in roughly a 73-minute period from the beginning of the eclipse to its peak obscuration.
Then, from 10:24 to 11:17 a.m., solar generation rose 4,064 MW, to 6,909 MW. At 11:17 a.m., the market started using economic bids to curtail solar production, a common occurrence on high-solar days. Even more impressive was the fast climb of solar output following the conclusion of the eclipse, between 11:55 a.m. to 12:13 p.m., when the ramp rate was an average of 150 MW per minute. This was a result of solar generators coming back online all at once.
During the eclipse, electricity imports added about 3,000 MW to the system. The energy coming across interties (interconnections between utility systems) was scheduled in the day-ahead market, a key part of the ISO’s preparations to shore up supply in advance of the eclipse. Additionally, thermal generation increased by 1,594 MW, while hydroelectric sources edged up 791 MW. The ISO’s real-time western Energy Imbalance Market provided about 650 MW of imported electricity as the sun went behind the moon. Coming out of the eclipse, the market exported about 750 MW of energy, which helped manage the dramatic rise of solar production.
Demand on the system during the eclipse increased, from 29,056 MW at the beginning of the eclipse to 30,952 MW at the peak of the event. A rise in load is typical for that time of the day, and was expected to be more pronounced as rooftop solar output fell off and customers drew energy from the grid. The system also had to fill in for reduced wind production of about 200 MW.
Energy prices rose only moderately during the eclipse, again the result of coordination with generators to participate in the day-ahead market. The average wholesale electricity cost was $16.79 per MW hour at the beginning of the eclipse, rose to $22.27 at maximum obscuration, then normalized to $16.15 by 11:17 a.m. The price increase was expected, because fast-ramping resources were needed to fill demand and stabilize the system, and those are generally higher-priced in the market.
After you register, try our four-week free trial to receive all of what Agri-Pulse has to offer! Click here to get started today!
